You’ll all have seen them, those amazing pictures that simply tell a story by displaying the most important facts in a creative way. Infographics are a great way to spice up your content ideas as they turn the most boring of subjects into something that can be made really interesting. Now whilst we know that infographics are not so easy to create, there are some good d-i-y tools you can use once you’ve got your idea. (actually thats the tough bit!!)
Once you’ve got your idea and researched enough figures and facts about it then you’ll want to move onto creating an infographic. So here are some tools that you can use for that part
Visual.ly : This site is great for everything to do with infographics. You can share infographics already in existence by browsing through the categories and start creating your own (if you supply your email address they’ll give you one free template to start off with). Once you are logged in you can select a template then customise it with your information. Simple! We are also loving the new Google Analytics report that will give you a visual representation of your website performance – neat!
The second tool worth a mention is
Infogr.am : this tool again is free and requires no design skills to use. Again simply choose which type of chart you want to use, upload your data and then share or embed your infographic, if its private you can also set a password so that only users you know have access can see it.
Of course a secondary result of putting together a really good infographic is that other people may well want to use what you have created, this of course create a multitude of backlinks to your website which can only be a good thing, and to prove that point heres a great infographic by Customer Magnetism that demonstrates a picture really can say a thousand words!
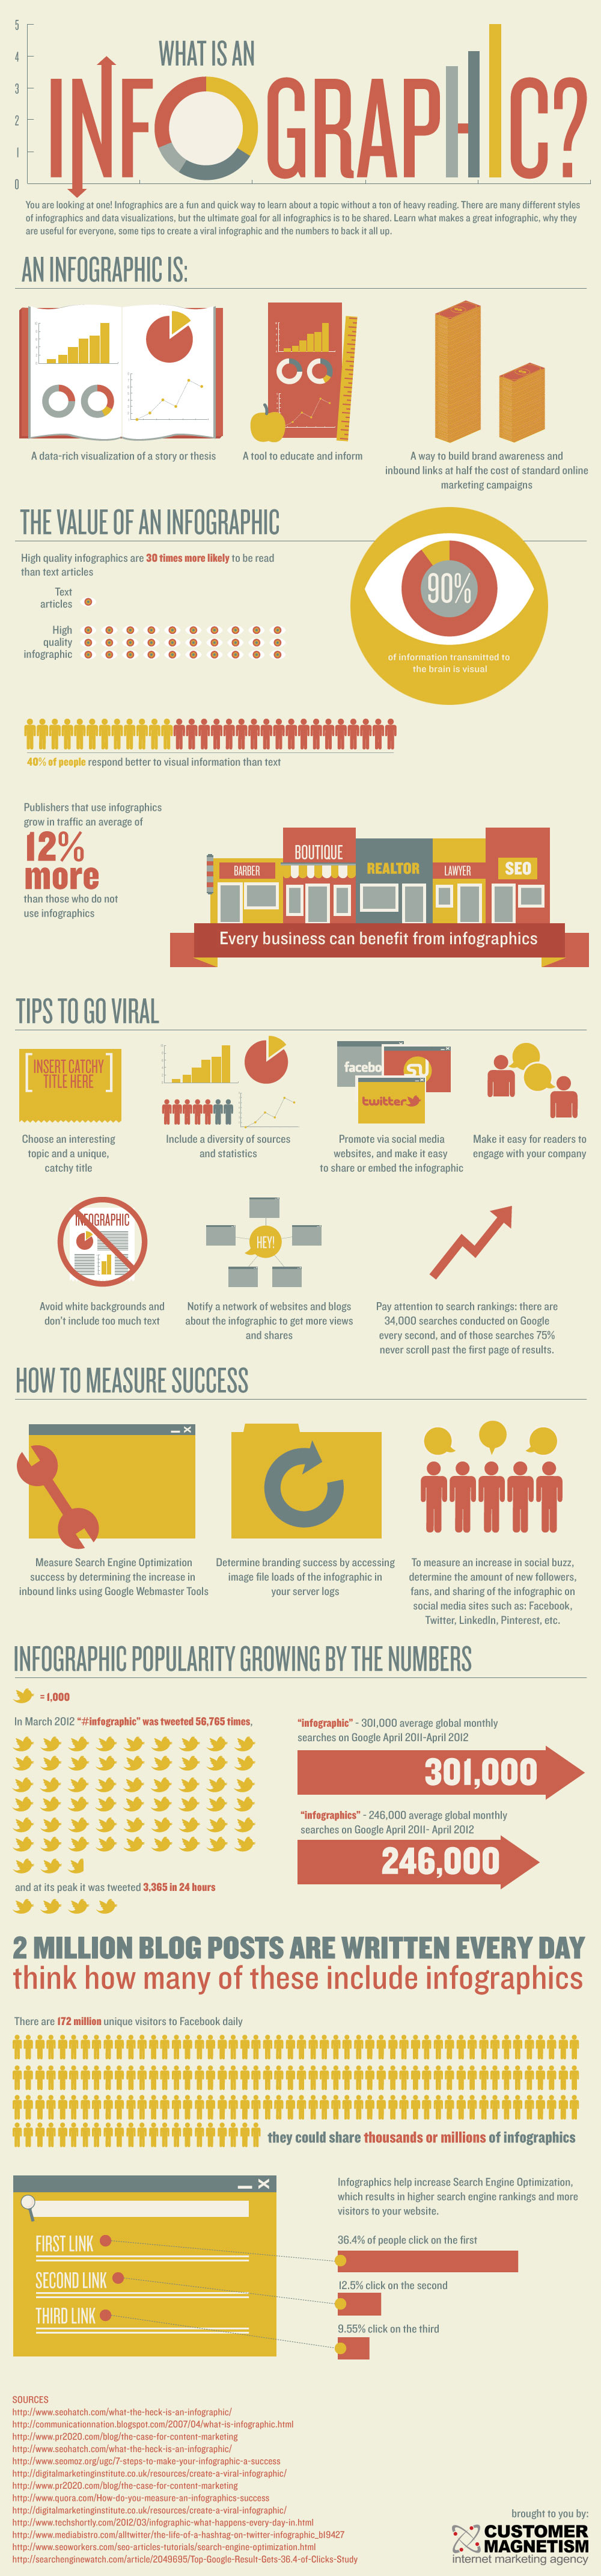
Created by Customer Magnetism, an award winning Internet marketing agency.